
CLIMATE MATTERS 140
I don't believe in Peter Pan, Frankenstein, or Superman, all I wanna do is bicycle, bicycle, bicycle. (Freddie Mercury) It's long overdue we gave cycling infrastructure the credit it really deserves.


There is a massive irony that a government that paints itself as being tightly focussed on economic efficiency is pushing flat out to build hugely inefficient highways that struggle to break even. Yet they are cutting support for cycling infrastructure that typically yields better than 10:1 benefit to cost ratio (and brings multiple other benefits).
“80% of climate solutions end up being cheaper over 30 years than what we do today.” Jon Foley, director of Project Drawdown, with Simon Clark here (4 min in).
Bike infrastructure is the most cost-effective climate strategy globally.
If you like fast-moving expert podcasts, you’ll love Simon Clark’s quest for the most cost-effective climate strategy, here. Clark uses his PhD in atmospheric science to engage with Project Drawdown leader Jon Foley to explore climate strategies and costs. After crunching countless numbers, the result is clear: cycling infrastructure wins by a country mile.
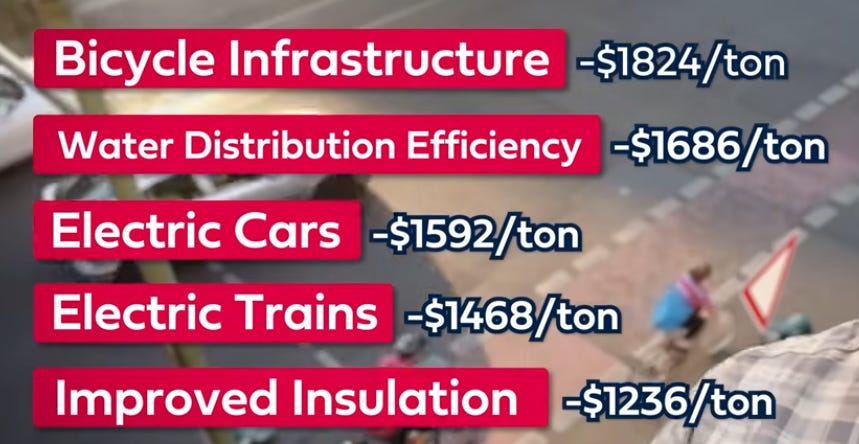
(BTW “Water distribution efficiency” is basically fixing leaks! Sound familiar?)
Professor Ralph Chapman: Active travel infrastructure pays 11:1
In 2018, urban economist Professor Ralph Chapman and colleagues pioneered ways to assess the economics of active travel infrastructure, particularly in middle-sized New Zealand towns (here). They went to lengths to test their calculations with different scenarios, and by comparing towns with and without suitable infrastructure programmes, and concluded “The benefit/cost ratio of the programme (over 10:1) is well in the range to justify the investment involved.” The increase in active travel also resulted in reduced vehicle km traveled and lowered emissions by 1.21% p.a.
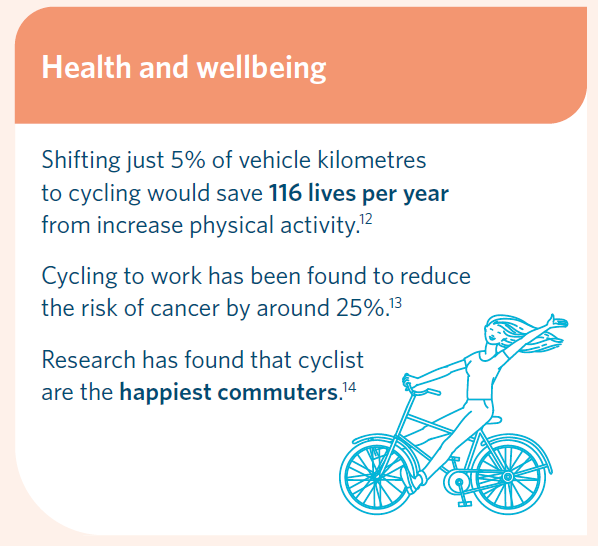
Chapman isn’t the only Kiwi pioneer in this field. Otago’s Professor Alexandra Macmillan has a background in environmental health: “For every dollar we spend on gold standard cycling infrastructure we get tens of dollars back in health benefits.” (At 23 minutes in here if you want to hear for yourself!)
So much for the economics of cycleways, what about the climate?
The US Institute of Transport Development and Policy (ITDP) has compared roads and cycleways in terms of climate impacts. In summary, cycleways giveth and roads taketh away - almost in equal quantities. $1m spent on roads was found to cause almost 5000 tonnes of CO2, while $1m on cycling infrastructure resulted in almost 5000 tonnes of CO2 reduction.
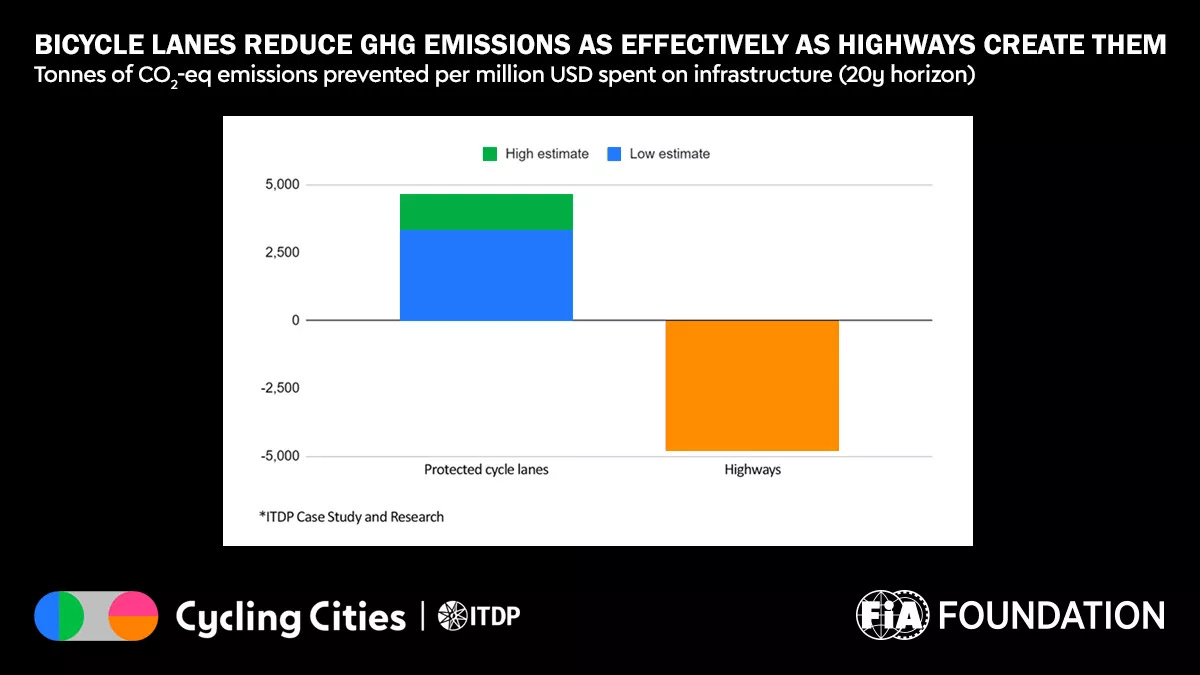
“As part of ITDP’s global Cycling Cities campaign and with support from the FIA Foundation, this report finds that networks of protected bicycle lanes in middle-income cities reduce greenhouse gas emissions, lower transport costs, and prevent premature road fatalities in a highly cost-effective way.” Institute of Transport Development and Policy
And Waka Kotahi (NZ Transport Agency) understands too.
In 2023 they brought out the “Waka Kotahi Cycling Action Plan” (here). It’s got lots of good stuff and their first priority is “plan connected cycle networks which support safe, everyday, local trips for everyone.” It’s so simple it’s worth pausing to make sure it sinks in. “plan connected cycle networks...” So many towns, like Nelson where I live, or New Plymouth at the start of Ralph Chapman’s study, have badly fragmented cycleways: lots of good bits with gaps crying out for investment. “…safe, everyday, local trips for everyone…” - we’re not talking tourist trips like the Otago Rail Trail or Nelson/Tasman’s Great Taste Trail, but making it easy and safe for locals to get-to-the-shops, get-to-study, get-to-work, get-to-sports.
Got the message? Good cycleways pay big time!

A New Zealand cameo inspired by “The Ends of the World”.
CM 139 sang the praises of Peter Brannen’s book “The Ends if the World.” And that led to me learning that the same book inspired Newsroom’s Marc Daalder to write an echoing snapshot of Aotearoa New Zealand. It’s a long read and well worth the time. “In 1996, scientists found a time machine buried deep in the Antarctic ice…”
I feel an Aussie special coming on…
Not enough space in this CM, but there’s been lots on the Aussie front. Here are a few thought-bites for starters.
Today the Government gave final approval for the North West Shelf extension, one of the largest fossil fuel projects in Australian history, locking in huge quantities of gas exports until 2070. The scale of this project is jaw-dropping. Over its lifetime, it will release around 4.4 billion tonnes of CO₂, roughly ten times Australia’s current annual emissions. [or 60 years of NZ emissions at current rates.]
Australia needs a contemporary framing of security that places the biggest threat to our future — climate disruption — at the centre of defense and foreign policy.
The Government has just set Australia’s 2035 climate target: a 62% - 70% cut to climate pollution based on 2005 levels. The low end, in the 62% range, falls dangerously short of what’s needed to protect Australians and our way of life. In the face of catastrophic risks, this is simply too timid for our times. The top end, 70%, is a step forward. It’s closer to what’s needed, but still not enough to protect our kids’ future. But a 7 in front of the target indicates that public pressure - from the thousands of you who spoke up - has shifted the dial.
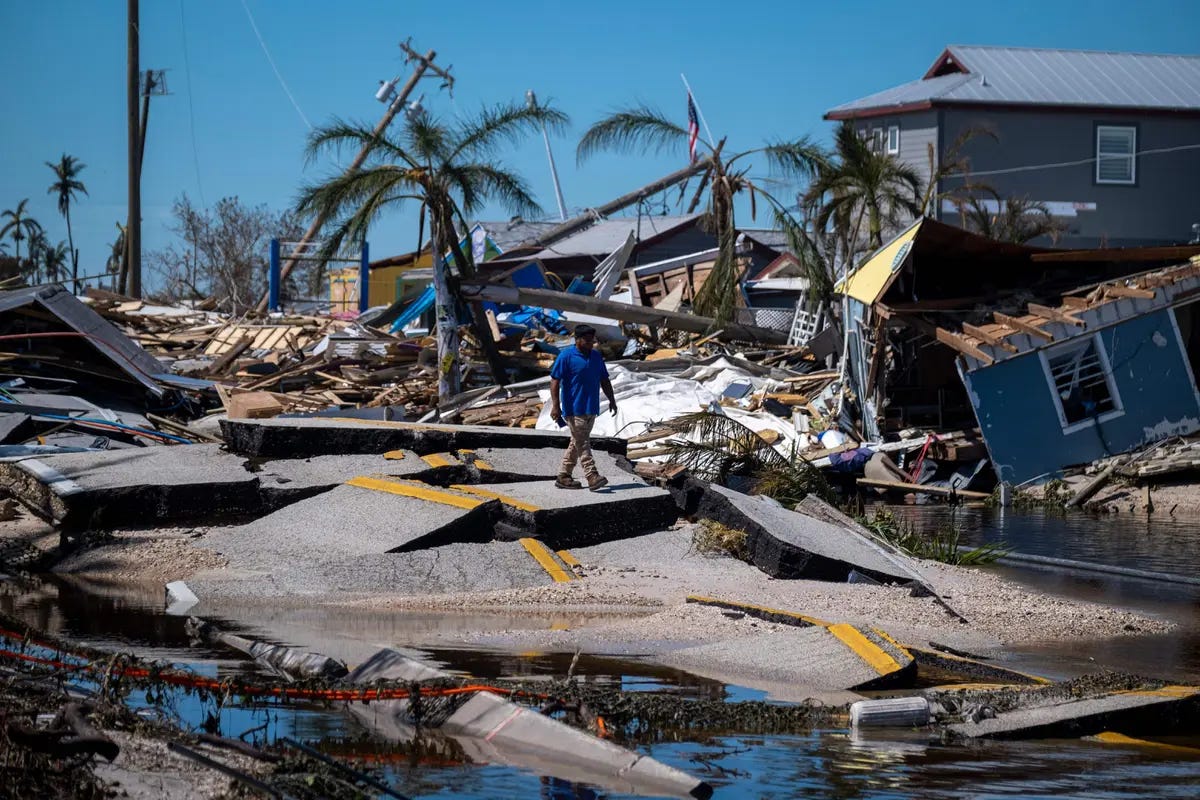
Remember “Wet Feet: Insurance Retreat”?
CM has referenced Belinda Storey’s podcast a couple of times. Earlier this year we also quoted Gunther Thallinger, a director of global insurance giant Allianz, on how entire regions could suddenly become uninsurable and collapse.
Yale’s Environment 360 has just sounded fresh warnings - well, the same but freshly made. “We are marching toward an uninsurable future in this country and across the globe; marching into the abyss.” From 2018-2023 nearly 2 million US homes became uninsurable due to rising climate risks.
“The insurance crisis in the U.S. is the canary in the coal mine, and the canary is dead,” Dave Jones, former insurance commissioner of California.

Where/how do we balance capex carbon and opex carbon?
If you read the comments on CM 139 you’ll have seen Tur asking for clarification: “I can’t find the impact of capital expenditure and depreciation in the analysis you quote above.“ I replied with a poorly chosen example (an extreme case that did little to illuminate help the discussion). So, take 2.
Firstly a caveat: Tur couched his query in business accounting terms. At the risk of losing nuance, I am transposing them to carbon accounting terms.
A core issue with a mix of capital and operating transactions, money or carbon or whatever, is how to compare the two, one fixed and one progressive, to get a coherent picture. The initial cost of say a building can be “amortised” over a certain number of years and so be related to the building’s ongoing operating costs.
Take building insulation. If we were fixated on minimising upfront costs, we wouldn’t insulate our buildings at all. However as soon as we factor in the cost of heating, or health benefits, we need to weigh up the upfront cost of insulation against ongoing benefits and savings.
The same applies to carbon. Insulation comes with a carbon footprint, “embodied carbon” (about a tonne of “CO2e” for a modest house). This year the national grid has run at average emissions of 102 gCO2 per kWh, meaning the insulation would need to save some10,000 kWh before “breaking even” from a carbon perspective.
That comparison can also translate to dollars, At 30c/kWh for power, the saving from10,000 kWh saved would be $3000. (FYI the price of those batts is more like $9000. They would have to save 30,000 kWh before paying for themselves on cost).
But the rabbit hole gets deeper.
Sticking with buildings, a distinction is made between “embodied carbon” from GHG gases emitted in the production of the building, and “operational carbon” associated with running it. In 2022, MBIE issued a methodology for “Whole of life embodied carbon assessment” , and a parallel “Operational efficiency assessment: Technical methodology” for operational carbon.
The image below shows all the processes to be assessed for “whole of life embodied carbon” (with green background) and the two for “operational carbon” (bright green outline). These form part of the wider discipline of “Life Cycle Analysis.”
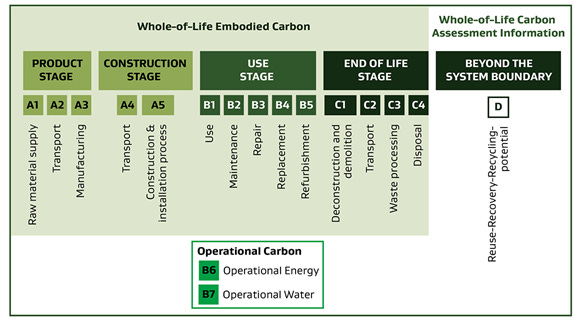
And to make it even more complex, note “repairs and maintenance” are treated as embodied carbon (i.e. “capital” in financial terms). In houses, carpet replacement is a major source of emissions. Which brings us back to Tur mentioning “depreciation”.
To make sensible predictions of emissions for the replacement of items, we need a realistic idea of their “service lives.” However, these are often hypothetical, with little relationship to the real frequency of replacement. Making predicted carbon emissions for R and M is similarly hypothetical.
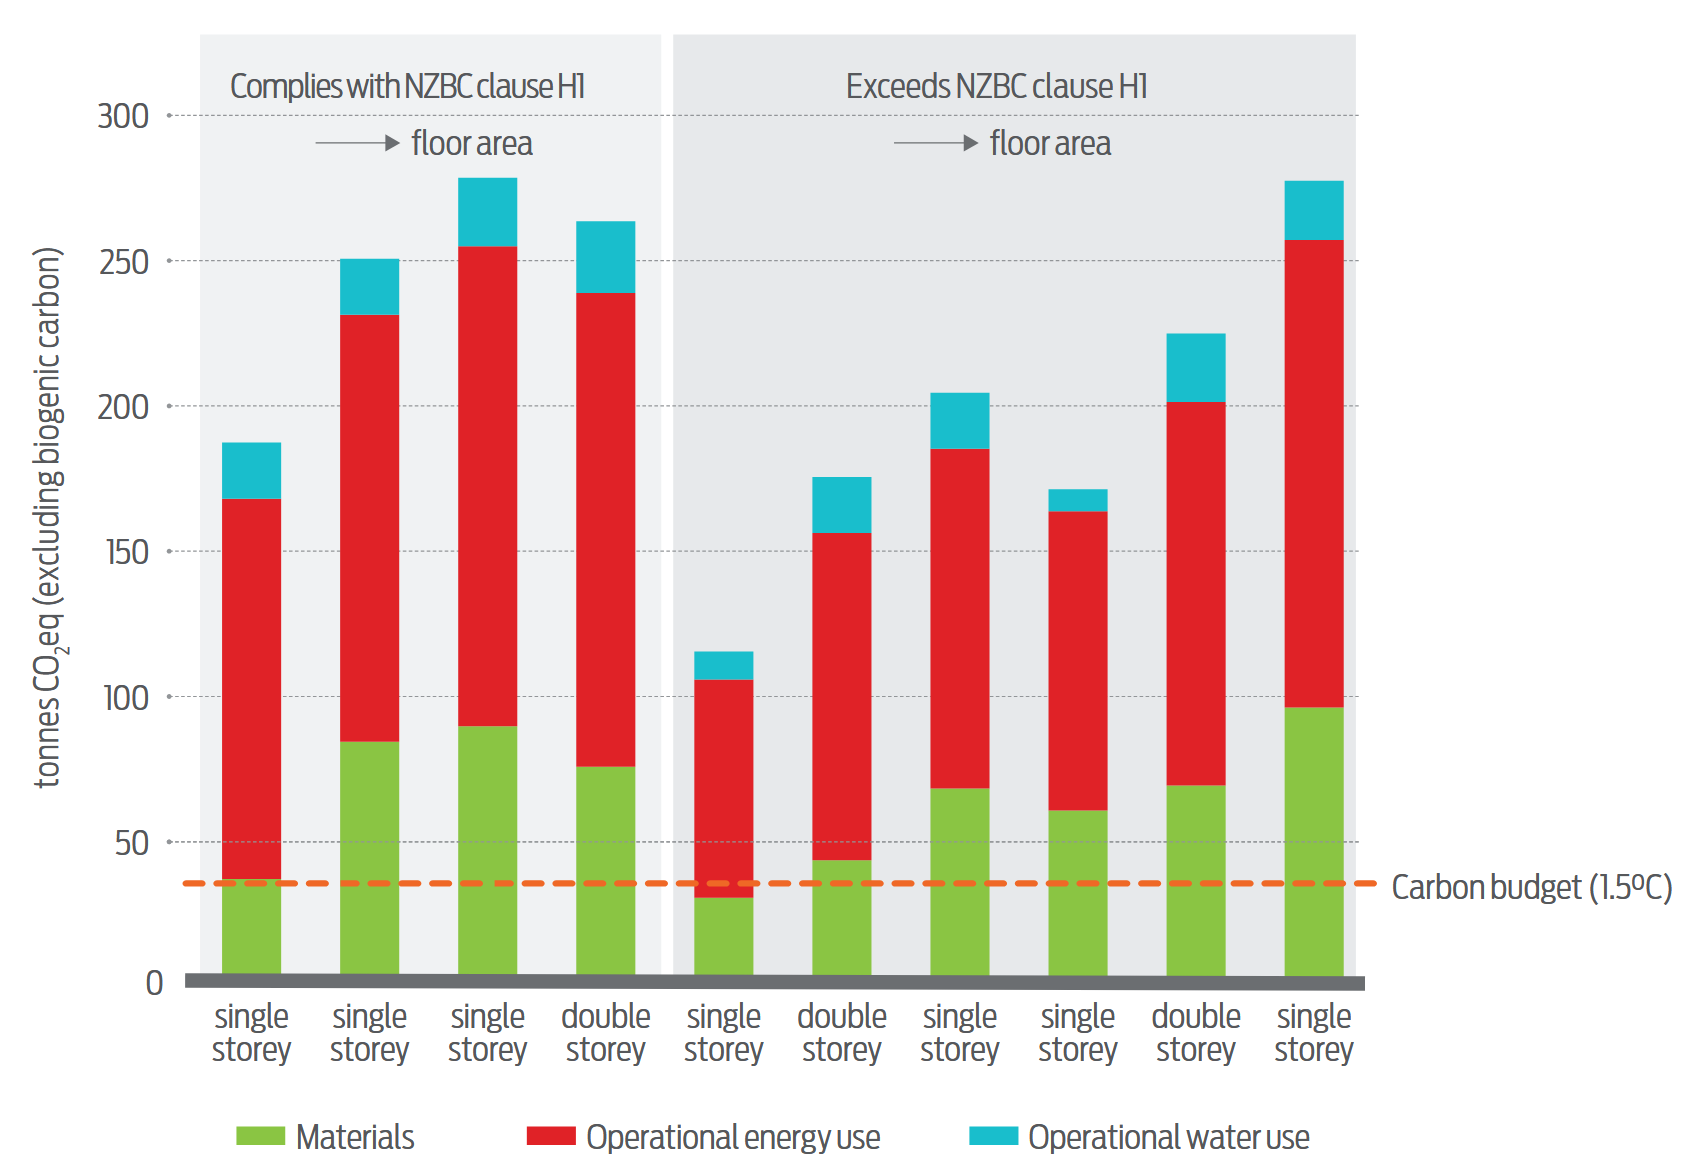
The image below, from the Building Research Association, BRANZ, (here ) illustrates some of these points for the lifetime emissions for ten house designs. The green (“materials”) is the embodied carbon from construction, the red and blue are operational carbon from using energy and water.
It’s easy to see lifetime operational carbon, and energy especially, greatly exceeds the embodied carbon (a bit more insulation might not be a bad idea!).
And one other thing: the orange dashed line shows a lifetime carbon footprint to fit our Paris Agreement commitments. As green represents the construction carbon, nine of the ten houses had used their entire lifetime budget of carbon before anyone had even moved in. Food for thought.
Before ending I must veer into another branch of the rabbit warren, and that is the carbon from making our energy infrastructure,.
So far nobody has figured how to make renewable energy infrastructure using just renewable energy. e.g. lots of the ingredients in a wind turbine involve mining and manufacturing processes that remain dependent on fossil fuels. The best we can hope for at present is to get a really long and productive life from the turbine, before repeating the cycle of mining, processing etc.
So putting that back into Capex carbon and Opex carbon terms, there is no such thing as “100% renewable electricity,” at least not if we mean with zero emissions. The best we can currently hope for is to optimise the efficiency and longevity of the components, so as to maximise both their output and their life, and thus also minimise the associated emissions.
We need to learn to use our energy far more wisely.
Thanks John. The architectural profession (and I am a member) is struggling with itself, and struggling to disavow the traditional preoccupation with glitz and novelty and scale that it has promoted for so long. I'm no psychologist but I suspect we need that oxymoronic situation where we get our biggest ego-gratification from being humble, and then develop the tools to persuade our clients on that journey.
In an era of a prolonged housing affordability crisis, to say nothing of the construction sector's horrendous emissions, one would think the old mantra "small is beautiful" might have regained more traction...
Hello Lindsay Wood. We never did finish our convo in the Reefton Camping Ground because it flooded eh. Totes agree with your wise words about mv emissions. My go to is that during the C19 level 4 shut down Auckland Transport measurement of traffic emissions was zero or immeasurable.
As for renewable energy until 18 months ago the government was going for Pump Hydro at Lake Onslow to meet emergency and dry years. No need for fossil fuel in NZ because, as I said to Dave L, just now, all we need to do is send the overstayer at Tiwai home and NZ has a surplus of hydro